How to Become a Data Scientist

Nearly everything you do generates data. Visit a website: Data. Tap an app on your phone: Data. Buy something with a credit card: Data. Like or upload a picture on social media: Data. Billions of people are generating immense amounts of data every single moment of every single day.

That’s some big data, and it’s only getting bigger. Imagine what can be done with all that information–data scientists are doing exactly that. Data science is essentially the art of solving problems with data. You might have trillions of rows of data, but on its own that information means nothing. It takes work and specialized skills to transform it from unintelligible noise into something that can be easily understood.

Woven into all this data is information that can improve quality of life, identify societal issues, and address global crises. Now more than ever the significant advancements that can result from data are essential to find–it’s no surprise that being able to understand, analyze, and interpret data is a highly desirable skill.

What do Data Scientists actually do?

Let’s get started by breaking down two of the most commonly asked questions––what is data science, and what are the responsibilities of a data scientist?

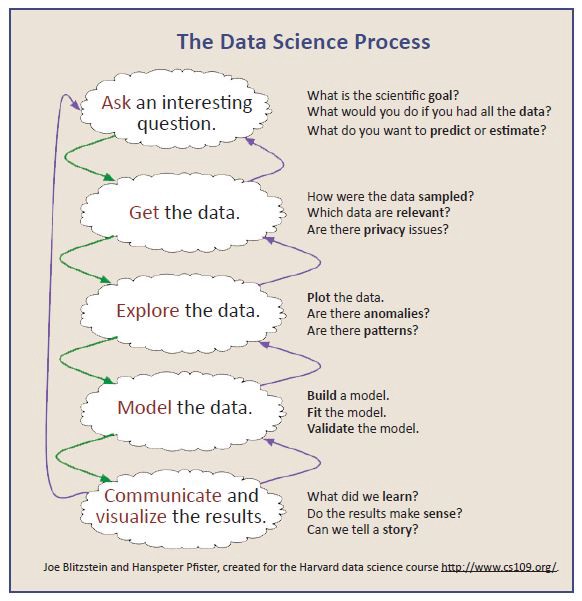
Data science is all about diving into a well of information and shaping it into a tool that you can use to accomplish a goal. Data scientists process data so it’s human-readable, building visualizations that tell a story or models that explain a process or predict behavior. Other times experiments are run to validate hypotheses in an attempt to prove them. The essence is that the raw data is used to output something that is valuable in that you can do or learn something with it.

Data Science job titles include:

  • Data Scientist
  • Data Analyst
  • Business Intelligence Analyst
  • Machine Learning Engineer
  • Junior Data Analyst

What skills do Data Scientists need?

This rapidly expanding field is tackling some of the biggest problems in the world today. But what does it take to actually be a data scientist?

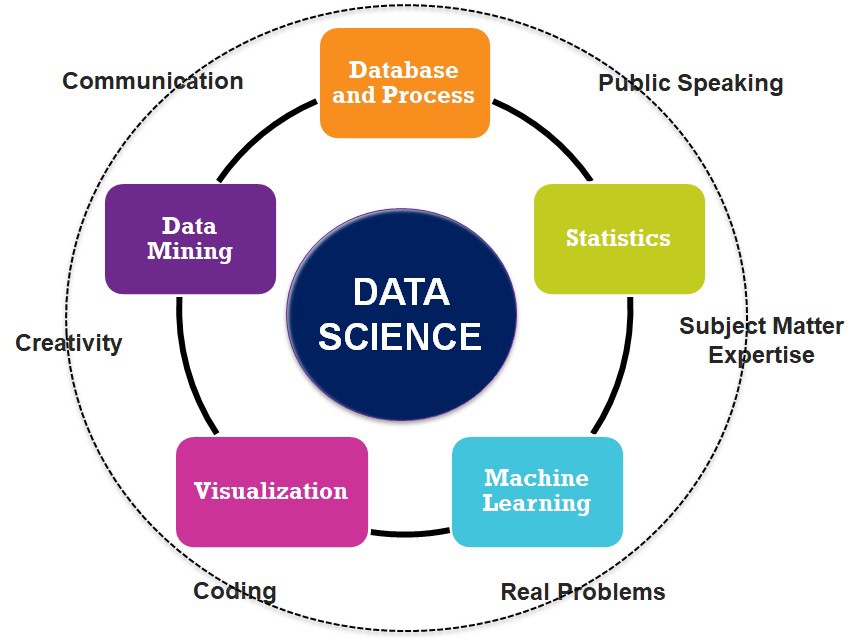
Before you even begin learning the technical skills to get you into the industry, focus on the soft skills you likely already possess. These are integral to landing your next career as a data scientist:

  • Communication
  • Creative Thinking
  • Relationship Building
  • Authenticity
  • Persistence

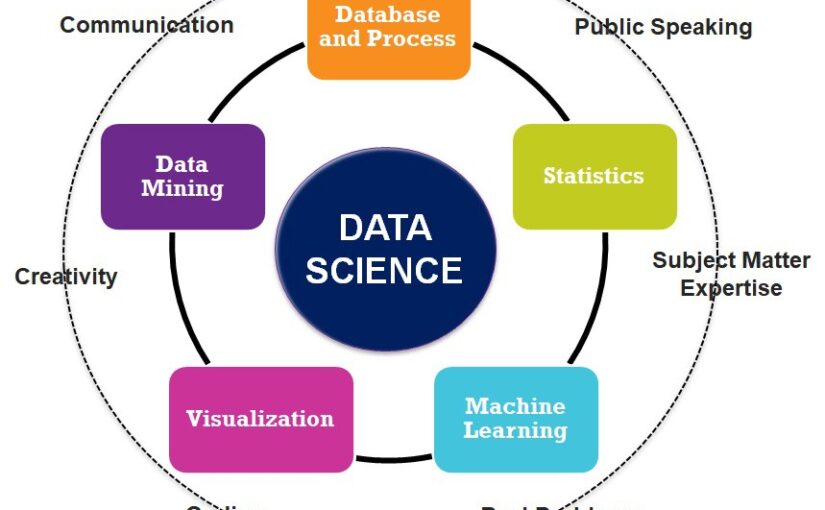
Technical skills that are essential to get the job done, perform at a high-level, and meet career goals include:

  • Advanced programming and deep mathematical knowledge
  • Passion for finding and solving problems
  • Analytical techniques like how to make visualizations and use summary statistics
  • Understanding of A/B testing and statistical significance
  • Python to gather and present data, then identify insights
  • SQL for querying
  • Machine learning with supervised and unsupervised models

Data science is rarely cut and dry. It isn’t simply “apply this technique” or “run this program”. While necessary, that’s usually the easy part. You need a thorough understanding of the problem so that you can determine which tools are best suited to your task. One of the most important skills for a data scientist is the ability to find solvable problems. Learning data science, then, is not merely combining programming with statistics — it includes that, but also requires context. You need to understand the domain that you’re working in, so you can test your hypotheses in the real world.

How do I become a Data Scientist?

Learning anything requires a positive feedback loop. In designing our bootcamp courses at Niminq, we’ve found that students learn best with:

  • 1-on-1 mentorship and career coaching
  • A comprehensive curriculum with built-in check-ins
  • Capstone projects that build a real-world portfolio

We offer a flexible program data science course to allow you to choose the best format for your life. Our state-of-the-art curriculum will teach you all the skills you need to launch a successful data scientist career. Some of the highlights from our data science curriculum include:

  • Analytics and Experimentation using Python and SQL
  • Machine learning using supervised and unsupervised models
  • Advanced specialization skills

We’ve built our programs to fit your needs and set you up for success. All courses are delivered 100% online and include advanced project-based curriculums and current industry tools to build real-world capstone projects. 

Questions to unlock valuable insights for your analytics project

To ask the right question is already half the solution to a problem

There is a bad joke out there that a data scientist is someone who is very successful at solving the wrong business problems. This is due to many projects that data scientists and analysts undertake which do not necessarily deliver any business value.

It’s often easy for data analysts and data scientists to be carried away by fancy algorithms and start “forcing” business problems to be solved by the algorithm even if by solving the problem there will be no tangible business value. The quality of the insights you get from the analysis is greatly influenced by the quality of questions you ask. Asking the right question about the data and the business processes often leads to the right approaches for analyzing your data.

Asking questions helps you fit into your stakeholder’s shoes and understand the business problem they want to solve. Questions are a good way of assessing your stakeholder’s motivations and financial interests. But truth be told, it’s not as easy to get to that one right question that will give you all the insights you need to drive some form of decisions in the business. What you can do, you can start by asking lots and lots of questions. when you have a good grasp of the business, ask more direct questions to understand what your stakeholders want to solve. Now you have a few questions to concentrate on. Analyze them or discuss them with the stakeholders until you get to “the” question(s).

Mastering the art of asking questions is an invaluable skill to have for data-related professions. By raising many questions, you are able to filter the most significant question which shapes the course and impact of your analytics project. In this blog, we shall look into 5 levels of questions that should act as a guide when undertaking an analytics project

1. What is the problem am trying to solve?

This might sound obvious but many data analysts are quick to dive deep into data projects without a clear understanding of the underlying problem or expected results. Successful data analytics projects begin with an understanding of the problem the business is trying to solve. This is the stage where domain knowledge of the business comes in handy.

Sitting down to frame the business problem you are trying to solve places your project on the right course. Using the adjectives referred to by the famous S.M.A.R.T acronym can set you on the same page as your stakeholders.

2. Which metrics will define my success?

As the old adage goes “What can be measured can be improved”. This question helps you know the indicators that will define the direction and success of your analytics project.

This question helps to decide on which metrics and KPIs should be measured, how they should be measured, and what would be success indicators?

For instance, if you are running an analysis for call center data you can choose to measure the “average speed of answer” as a metric to define the performance of each agent. You can decide to set a threshold of an ideal spread to answer and measure the agents that fall below and above the thresholds as success indicators.

3. What data do I need?

After you have all the metrics you need for the project, the next set of questions revolves around which data you will need for the metrics. Analyzing the most important metrics before embarking on a data search makes your search for relevant data direct and focused.

In this phase, it’s important to write down a set of all variables you will need. Then ask if the data is available and indicate the source of it. Some you get by querying the database, some you might need to scrap from the web. Whichever the source, it’s important to know what’s available and what’s not. For the data that is not available, you indicate how you can get it and the process that will be involved.

Another set of questions to ask together with the data needed is the question of the accuracy and quality of your data. If it is a sample dataset, is it a true representation of the population you will be inferring to? Remember clean data always beats fancy algorithms.

4. What statistical analysis and visualization will you need to apply?

At this point, you are already clear about the problem you are intending to solve, the metrics you will be measuring and the data you will need. Now, you assess which statistical methods will work best in analyzing your data? and which models will you need to build? For EDA(Exploratory Data Analysis) which graphs will work best in visualizing your trends and uncovering patterns? Which tools will be used to clean and analyze the data?

A trick you can use to cub this question is to write down the visualization type and analysis method you need next for each metric you intend to measure. if you want to show a metric and compare categories, choose a bar graph. Line graphs work best for time series analysis. Scatter plots are best to show the relationship between two numeric variables e.g Age and salary. Pie charts are good to show proportions of categories that add up to 100%. Pie charts are recommended only when you have categories less than 5.

5. How will you communicate the results to the key stakeholders?

The epitome of a successful analytics project is the effectiveness of results communication to the stakeholders. After the analysis, you want to communicate your results to the stakeholders in a way that will make them feel a certain way and take certain decisions. It’s important to ask a set of questions about the best strategy to use when sharing your results with the stakeholders?

Other questions that can help shape the way you present your results would be; What actions will be taken from the results of my analysis? What would be the cost of implementation of my recommendations? Are my results controversial to the business norms? what level of resistance am I expecting?

Conclusion

All through the analytics project, you need to ask questions and filter the ones that you think answering will provide great insights. Being a curious cat and skeptical about your data is a skill that will often make you to uncover trends and insights that lie beyond the surface. Nobody is interested to know what they already know. The trick to getting good at asking excellent data questions is to keep on asking them.

“If I had an hour to solve a problem and my life depended on the solution, I would spend the first 55 minutes determining the proper question to ask… for once I know the proper question, I could solve the problem in less than five minutes.”

Albert Einstein